Cambridge IGCSE Biology · 0610 · Paper 6
Paper 6 Skills: Alternative to Practical
AO3 · Experimental skills and investigations
What Paper 6 tests
Paper 6 (Alternative to Practical) is a written exam. You do not work in a lab, but you must show the same skills as Paper 5:
- Identify independent, dependent, and control variables.
- Complete or design results tables and graphs.
- Make or improve biological drawings and calculate magnification.
- Suggest errors, limitations, and improvements.
- Write a clear, numbered method for an investigation.
- Complete food tests, estimate populations with quadrats, and calculate rate or % change.
Theory notes explain what happens (e.g. osmosis in Chapter 3, enzymes in Chapter 5, photosynthesis in Chapter 6). This page explains how Cambridge tests investigation skills.
Independent, dependent & control variables
- Independent variable (IV)
- The factor you deliberately change. Only one IV in a fair test.
- Dependent variable (DV)
- The factor you measure. It depends on the IV.
- Control variables
- All other factors that could affect the result. Keep them constant.
- Fair test
- Only the IV changes; all control variables stay the same.
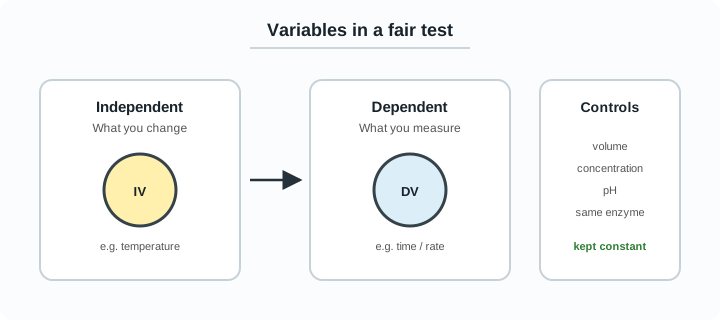
| Type | Question to ask | Example (amylase / starch) |
|---|---|---|
| Independent | What am I changing? | Temperature of the water bath |
| Dependent | What am I measuring? | Time for starch to be digested (or rate) |
| Control | What must stay the same? | Volumes and concentrations, pH, same enzyme batch |
Exam-style scenario: Equal volumes of starch and amylase are mixed in water baths at 20°C, 30°C, 40°C, 50°C, and 60°C. Every 30 s a drop is tested with iodine until the blue-black colour disappears.
- IV: temperature of the water bath
- DV: time taken for starch to be digested
- Controls: volume and concentration of starch and amylase, pH, same testing method
Tip: Values listed with different numbers (20°C, 30°C…) are usually the IV. Words like “measured”, “recorded”, or “timed” point to the DV.
Control experiments, range & repeats
A control experiment is a comparison set-up where the factor being tested is absent or at a standard level, to show the effect is genuine.
- Photosynthesis: foil on a leaf (no light) or soda lime (no CO2) — no starch made there (Chapter 6).
- Enzymes: boiled (denatured) enzyme with substrate — no reaction.
- Range
- Use at least five values of the IV, evenly spaced across a sensible range.
- Repeats
- Repeat each condition at least three times and calculate a mean.
- Anomalies
- Results that do not fit the pattern. Identify them and exclude from the mean with a reason.
- Reliability
- Consistent, repeatable results. Wide scatter means improve the method (e.g. thermostatic water bath).
State controls with quantities and units (e.g. 10 cm3, 30 minutes, 5 cm length), not vague “same amount”.
Results tables
A good Paper 6 table has:
- Clear column headings with units (e.g. Salt concentration / %, Change in mass / %)
- IV in the first column; DV (and repeats / mean) after
- Consistent decimal places; no units in every data cell
| Salt concentration / % | Change in mass 1 / % | Change in mass 2 / % | Change in mass 3 / % | Mean change in mass / % |
|---|---|---|---|---|
| 0.0 | +18.2 | +17.5 | +19.0 | +18.2 |
| 0.5 | +8.1 | +7.4 | +8.6 | +8.0 |
| 1.0 | −1.2 | −0.8 | −1.5 | −1.2 |
| 1.5 | −9.5 | −10.1 | −9.0 | −9.5 |
| 2.0 | −15.0 | −14.2 | −15.8 | −15.0 |
Percentage change = (final mass − initial mass) ÷ initial mass × 100. Blot potato cylinders dry the same way before each weighing.
Graphs
- Put the IV on the x-axis and the DV on the y-axis.
- Label both axes with quantity and unit.
- Choose an even scale that uses most of the grid.
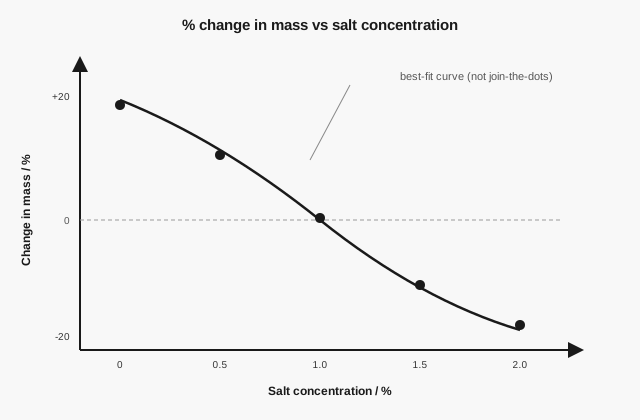
- Plot points carefully; draw a best-fit line or smooth curve — do not join points with a ruler if the trend is curved.
- You may be asked to interpolate (read a value between points) or describe the trend.
From the sample osmosis table, 0% salt gives about +18% mass (water enters) and 2.0% salt about −15% (water leaves). The concentration where mean change is zero is the point matching the cells’ water potential — read it from the graph, do not guess.
Exam Traps
- Axes without units lose marks even when the shape of the graph is correct.
- Do not force a straight line through curved osmosis or enzyme data.
Biological drawings & magnification
Paper 6 often asks you to draw a specimen or photomicrograph:
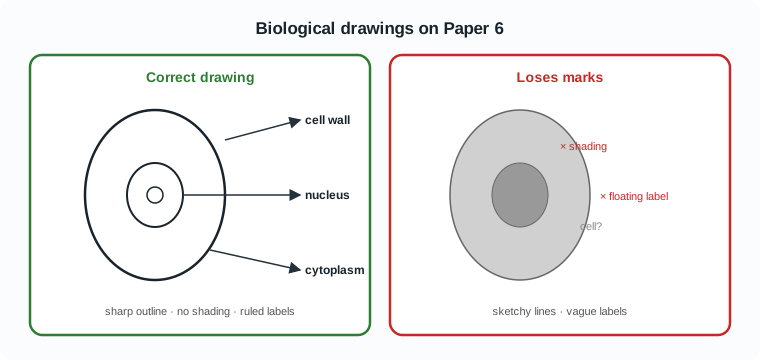
- Use a sharp, continuous outline — no sketchy lines.
- No shading or colouring in.
- Label with ruled horizontal lines that touch the structure; labels clear and outside the drawing.
- State magnification or include a scale bar if asked.
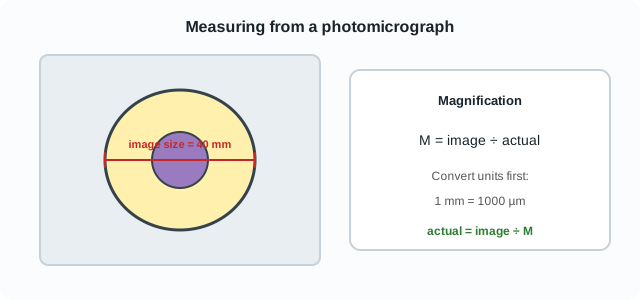
To find actual size from a photomicrograph: measure the image size (mm), convert to µm if needed (× 1000), then rearrange magnification. Full formula practice: Chapter 2.
Observations and food tests
Paper 6 often asks you to record colours or complete a results table. State the reagent, the condition (e.g. heat), and the positive colour. Full chemistry of the tests: Chapter 4.
| Test for | Method (exam wording) | Positive result |
|---|---|---|
| Starch | Add iodine solution | Blue-black |
| Reducing sugar | Add Benedict’s solution; heat | Green / yellow / brick-red (depending on amount) |
| Protein | Add biuret reagent | Purple / lilac |
| Fat / lipid | Ethanol, then water (emulsion test) | Cloudy white emulsion |
A negative result is the original reagent colour (e.g. iodine stays brown-orange; Benedict’s stays blue). Do not invent a new colour.
Sampling with quadrats
To estimate how many plants grow in an area, you cannot count every individual. Use a quadrat (usually 0.25 m2 or 1 m2).
- Random sampling: use random coordinates (or throw with eyes closed only if the question allows). Avoid choosing “typical-looking” patches — that is biased.
- Count the organisms (or % cover) in each quadrat.
- Calculate a mean per quadrat, then scale up: estimated number = mean × (total area ÷ quadrat area).
- More quadrats improve reliability.
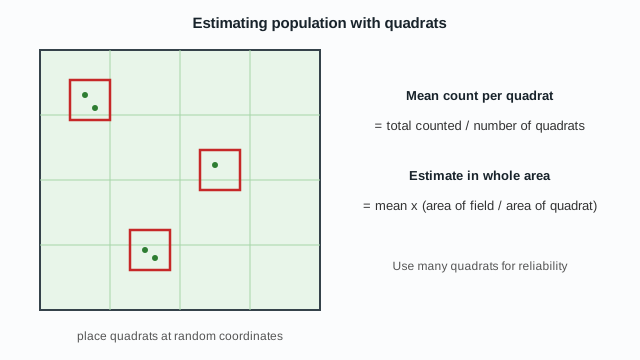
Worked numbers: Mean of 6 plants per 0.25 m2 quadrat. Field is 50 m2. Number of quadrats that would fill the field = 50 ÷ 0.25 = 200. Estimate = 6 × 200 = 1200 plants.
Calculations, trends and conclusions
Typical Paper 6 calculations:
- Mean = sum of repeats ÷ number of repeats (exclude a named anomaly).
- Percentage change = (change ÷ original) × 100. Include the sign if mass is lost.
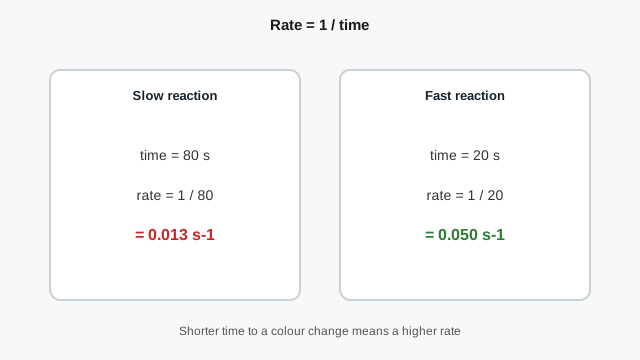
- Rate when you time a colour change or the disappearance of starch: rate = 1 / time. A shorter time is a faster rate.
Worked % change: Potato mass 8.0 g to 7.2 g. Change = −0.8 g. Percentage change = (−0.8 ÷ 8.0) × 100 = −10%.
When you describe a graph, say what happens to the DV as the IV increases, mention any peak or plateau, and use the data (with units). A conclusion links the pattern to the biology (e.g. “enzyme activity is highest at 40°C; above this the enzyme is denatured”) without inventing results that are not on the graph.
Errors, accuracy & improvements
- Accuracy
- How close a result is to the true value (better apparatus, careful technique).
- Precision / reliability
- How close repeats are to each other (more repeats, tighter method).
When asked for a source of error or improvement, be specific:
- Uneven blotting of potato → blot with the same number of tissues / same pressure.
- Temperature of water bath drifts → use a thermostatically controlled bath.
- Human reaction time with a stopwatch → use a data logger / light gate if appropriate, or time a larger change.
- Only two concentrations tested → use at least five values of the IV.
Do not write only “human error” — say what went wrong and how to fix it.
| Investigation | Typical limitation | Improvement |
|---|---|---|
| Osmosis (potato) | Surface water left on cylinders | Blot the same way; use % change in mass |
| Enzymes | Water bath temperature not constant | Thermostatic bath; equilibrate tubes first |
| Photosynthesis (bubbles) | Bubbles vary in size | Collect gas in a syringe / measure volume |
| Transpiration | Air leak in potometer tubing | Check joints under water; cut stem under water |
Writing a method
- Aim — one sentence stating what you investigate.
- Variables — IV, DV, and at least two controls with quantities.
- Equipment — list apparatus with sizes where relevant.
- Method — numbered steps; imperative verbs (Measure, Cut, Record, Repeat).
- Safety — relevant hazards (iodine stain, cork borer, hot water).
- Results table — headings and units ready.
- Graph — state axes (IV on x, DV on y).
Do not put results or a conclusion inside the method.
Full worked example — osmosis in potato
Plan an investigation to find how salt concentration affects osmosis in potato tissue.
- Independent variable
- Concentration of salt solution (0%, 0.5%, 1.0%, 1.5%, 2.0%).
- Dependent variable
- Percentage change in mass of potato cylinders.
- Control variables
-
- Same type of potato; cylinders cut to the same length and diameter
- Same volume of solution (e.g. 20 cm3) in each tube
- Same soaking time (e.g. 30 minutes)
- Same temperature; same blotting method before reweighing
- Outline method
-
- Cut five potato cylinders to 4 cm using a cork borer.
- Prepare salt solutions of 0%, 0.5%, 1.0%, 1.5%, and 2.0%.
- Weigh each cylinder and record the initial mass.
- Place one cylinder in each solution for 30 minutes.
- Remove, blot dry gently, reweigh, and calculate percentage change in mass.
- Repeat the whole experiment three times and calculate means.
- Plot mean % change in mass (y) against salt concentration (x).
Theory behind the mass changes: Chapter 3 · Diffusion and osmosis.
Second worked example — temperature and amylase
Plan an investigation to find how temperature affects the activity of amylase on starch.
- Independent variable
- Temperature (20°C, 30°C, 40°C, 50°C, 60°C) using a water bath.
- Dependent variable
- Time for the mixture to stop giving a blue-black colour with iodine / s; then rate = 1 / time.
- Control variables
- Equal volumes of starch and amylase (e.g. 5 cm3 of each); same concentrations; same pH (buffer if available); same drop size of iodine; same testing interval (e.g. every 30 s).
- Outline method
-
- Equilibrate separate tubes of starch and amylase in a 20°C water bath for 5 minutes.
- Mix, start a stopwatch, and test a drop with iodine every 30 s until it stays orange-brown.
- Record the time. Repeat at each temperature with fresh solutions.
- Repeat the whole set three times; calculate mean times and rates.
- Plot rate (y) against temperature (x). Expect a peak near the enzyme’s optimum.
- Safety
- Iodine stains skin and clothes; hot water baths can scald. Wear goggles; wipe spills.
Enzyme theory: Chapter 5.
0/8