Cambridge IGCSE Mathematics — 0580 Extended
Topic 2.9: Algebra and graphs — Graphs in Practical Situations
Conversion graphs
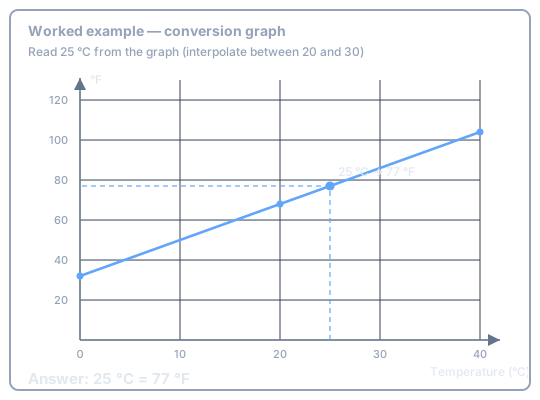
A conversion graph is a straight line linking two units (currency, \(\mathrm{^\circ C}\) to \(\mathrm{^\circ F}\), and so on). Read a value on one axis, go across to the line, then down or across to the other axis. If the value sits between grid lines, interpolate.
Method
- Find the given number on its axis.
- Draw a line to the graph, then to the other axis.
- Read the scale carefully — check what each small division is worth.
Use the \(\mathrm{^\circ C}\)–\(\mathrm{^\circ F}\) graph to convert \(25\mathrm{^\circ C}\).
Distance–time graphs
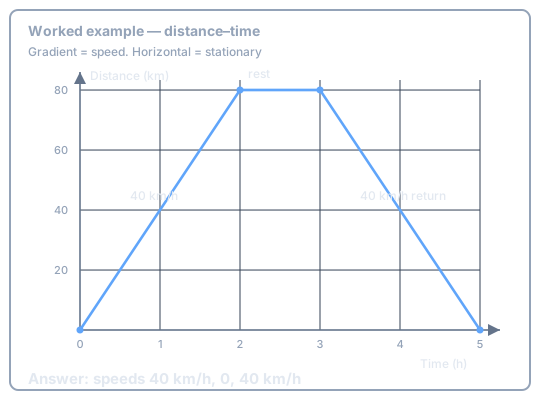
On a distance–time graph the gradient is speed. A horizontal section means the object is stationary (gradient \(0\)). A return journey slopes down if distance is measured from the start.
A cyclist rides \(80\,\mathrm{km}\) in \(2\,\mathrm{h}\), rests for \(1\,\mathrm{h}\), then returns the \(80\,\mathrm{km}\) in \(2\,\mathrm{h}\). Sketch the graph and find each speed.
Speed–time graphs
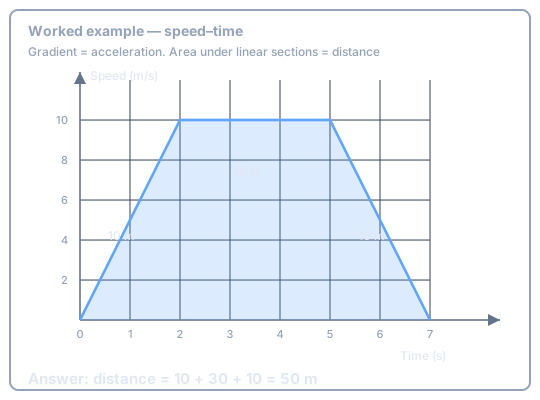
On a speed–time graph the gradient is acceleration. For linear sections only, the area under the graph is distance.
Method
- Split the graph into triangles and rectangles (linear pieces only).
- Distance \(=\) sum of those areas, using the units on the axes.
- Acceleration \(=\) change in speed \(\div\) time for that section. Deceleration is negative acceleration.
A particle accelerates from \(0\) to \(10\,\mathrm{m/s}\) in \(2\,\mathrm{s}\), stays at \(10\,\mathrm{m/s}\) for \(3\,\mathrm{s}\), then decelerates to rest in \(2\,\mathrm{s}\). Find the distance and the accelerations.
Tangents and instantaneous rate
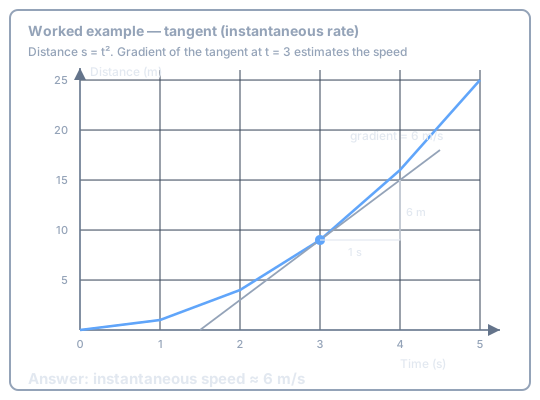
If the graph is a curve, a chord gives average rate. A tangent at a point estimates the instantaneous rate of change (the gradient of that tangent).
The distance–time curve is \(s = t^2\). Estimate the speed at \(t = 3\,\mathrm{s}\) from the tangent.
Paper 2 (non-calculator)
Keep units consistent: \(\mathrm{km/h}\) is not \(\mathrm{m/s}\). Convert mixed times before using a gradient — \(2\,\mathrm{h}\,30\,\mathrm{min} = 2.5\,\mathrm{h}\), not \(2.3\,\mathrm{h}\).
Try this
From the \(50\,\mathrm{m}\) speed–time example, what distance is covered in the first \(2\,\mathrm{s}\)?
Show answer
-
The first \(2\,\mathrm{s}\) is a triangle of base \(2\,\mathrm{s}\) and height \(10\,\mathrm{m/s}\)
\[ \text{distance} = \tfrac{1}{2} \times 2 \times 10 \] -
Final answer
\[ 10\,\mathrm{m} \]
Exam Traps
- Area under a speed–time graph is distance, not speed.
- Gradient of a distance–time graph is speed, not acceleration. Acceleration is the gradient of a speed–time graph.
0/10