Cambridge IGCSE Mathematics — 0580 Extended
Topic 8.2: Probability — Relative & Expected Frequencies
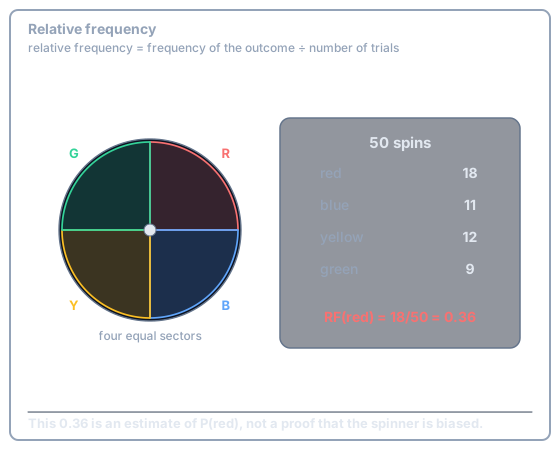
When you cannot list equally likely outcomes — a drawing pin, a biased spinner, a real population — you estimate probability from an experiment. That estimate is the relative frequency. Once you have a probability, you can predict how often the event should happen in \(n\) trials: the expected frequency.
Relative frequency
\[ \text{relative frequency} = \dfrac{\text{frequency of the outcome}}{\text{number of trials}} \]
It is an estimate of the true probability. A short experiment can sit a long way from the truth; a long one usually sits close.
Method
- Read the frequency of the outcome and the total number of trials.
- Write frequency \(\div\) trials. Cancel, or convert to a decimal if asked.
- Treat the result as \(\mathrm{P}(\text{event})\) only as an estimate.
A spinner is spun 50 times. Red appears 18 times. Estimate \(\mathrm{P}(\text{red})\).
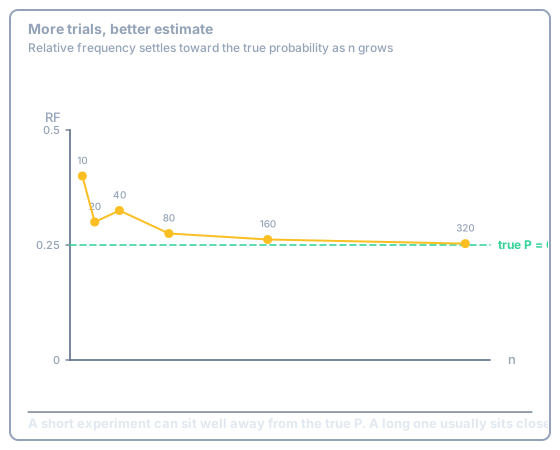
More trials, better estimate
As \(n\) grows, the relative frequency typically settles toward the true probability. One run of 10 spins that lands far from \(0.25\) is not evidence of bias on its own.
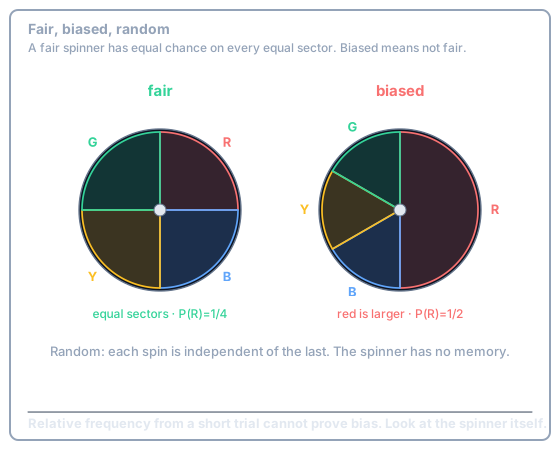
Fair, biased and random
A fair spinner (or die, or coin) has equal chance on every equal sector. Biased means not fair — one outcome is favoured. Random means each trial is independent of the last: the spinner has no memory.
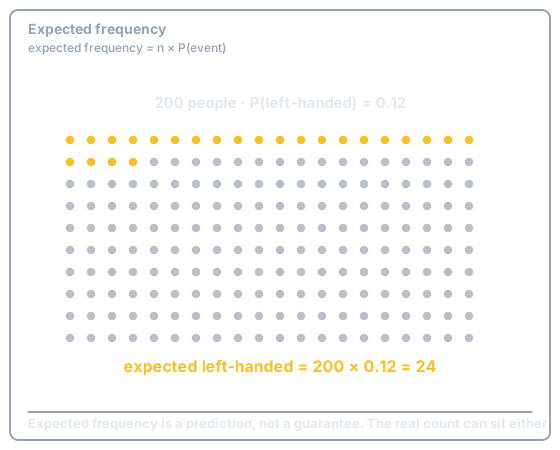
Expected frequency
\[ \text{expected frequency} = n \times \mathrm{P}(\text{event}) \]
It is a prediction, not a guarantee. The real count can sit either side of the expected value.
In a town, \(\mathrm{P}(\text{left-handed}) = 0.12\). How many left-handed people would you expect in a random sample of 200?
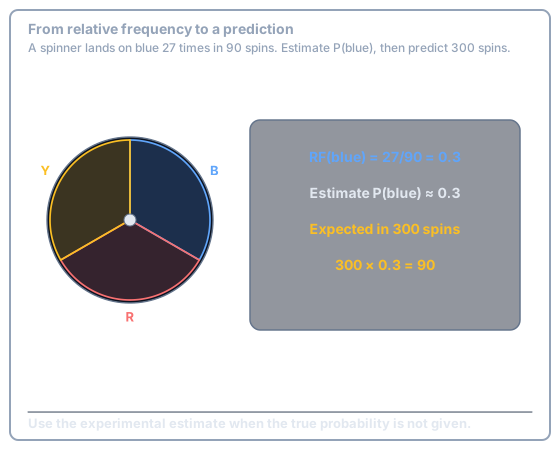
A spinner lands on blue 27 times in 90 spins. Estimate \(\mathrm{P}(\text{blue})\), then the expected number of blues in 300 spins.
Paper 2 (non-calculator)
\(80 \times 3/5 = 48\). Cancel first: \(80 \times 3 / 5 = 16 \times 3 = 48\). Do not expand into a decimal if the fraction is clean.
Try this
A fair cubical die is rolled 120 times. How many 6s would you expect?
Show answer
-
Fair die, so \(\mathrm{P}(6) = 1/6\)
\[ 120 \times \dfrac{1}{6} = 20 \]
Exam Traps
- Relative frequency is an estimate of probability. It is not the theoretical probability, and a small sample that disagrees with \(1/4\) does not prove the spinner is biased.
0/10