Cambridge IGCSE Mathematics — 0580 Extended
Topic 9.1: Statistics — Classifying Data
Statistics starts by naming the data. On Extended 0580 you classify it (qualitative or quantitative, discrete or continuous) and tabulate it — tally charts and two-way tables are the exam tools. A table that does not add up is already a wrong diagram.
Types of data
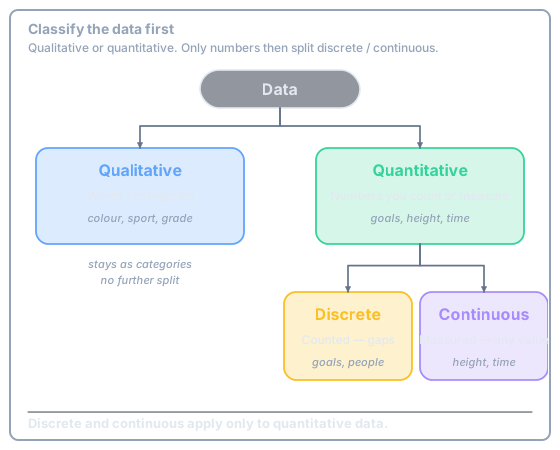
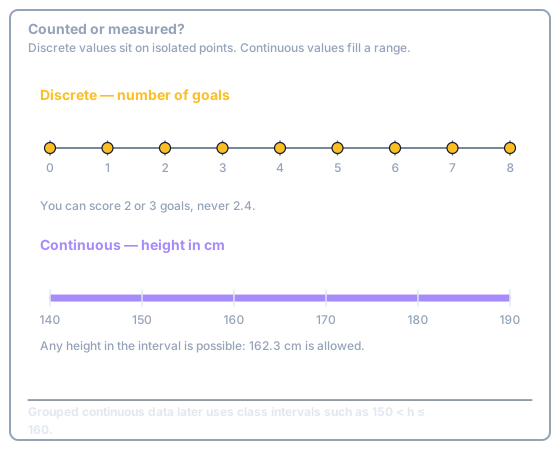
Qualitative data are categories (sport, colour, grade). Quantitative data are numbers. Those numbers are discrete if you count them, and continuous if you measure them.
Tally charts
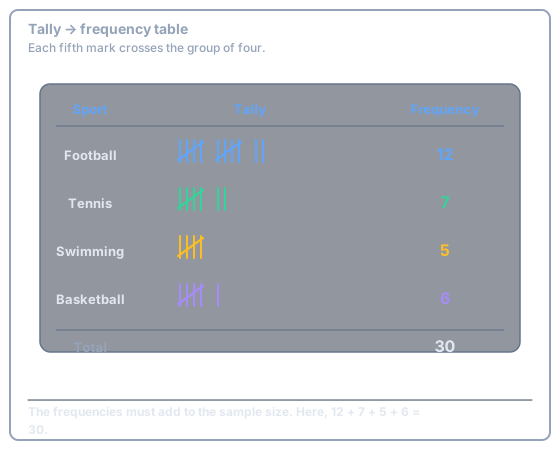
A tally is a running count. The fifth mark crosses the group of four so you can read the frequency in fives.
Method
- Write a row for each category.
- Add a tally mark for every observation. Bundle in fives.
- Write the frequency. Check that the frequencies add to the sample size.
30 students choose a favourite sport. Complete the frequency column.
Two-way tables
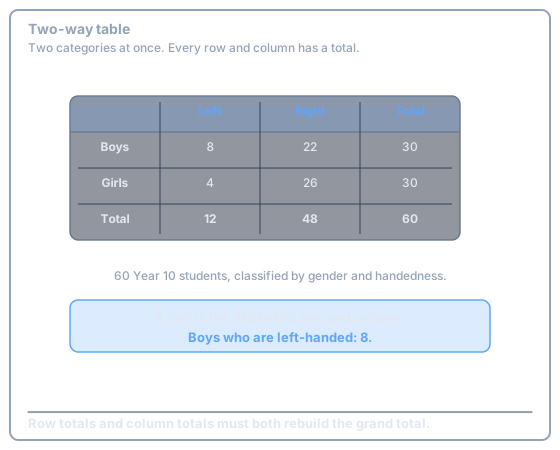
Two categories at once. Each cell is the AND of its row and its column. Row totals and column totals must both rebuild the grand total.
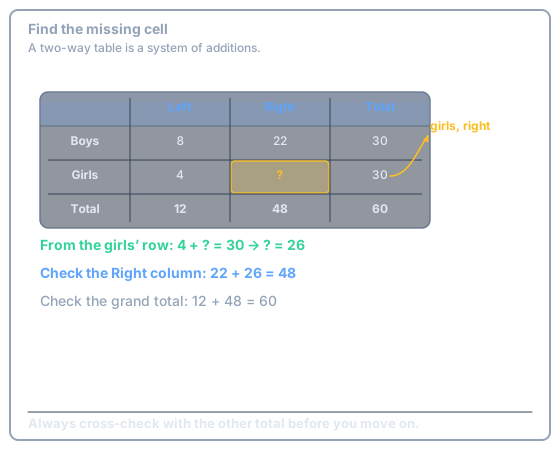
The girls–right cell is missing. Find it, then check the other total.
Discrete or continuous
Goals, people and shoe sizes sit on isolated points. Height, mass and time fill an interval — any value in the range is possible, so later grouping uses inequalities such as \(150 < h \le 160\).
Paper 2 (non-calculator)
Two-way missing cells are addition: \(30 - 4 = 26\). Check the other total before you write the answer.
Try this
From the handedness table, how many of the 60 students are right-handed girls?
Show answer
-
Girls’ row, Right column (already found as 26).
\[ 26 \]
0/10