Cambridge IGCSE Mathematics — 0580 Extended
Topic 9.2: Statistics — Interpreting Data
Extended papers ask you to read a diagram, compare two sets, and refuse a conclusion the sample cannot support. Quote an average and a measure of spread together. Underline the group named in the sentence before you pick a total.
Read the diagram
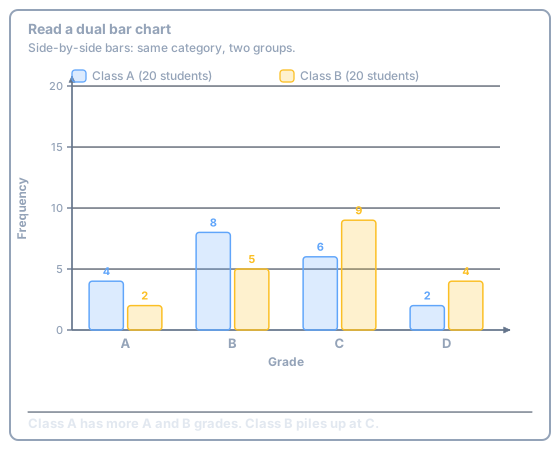
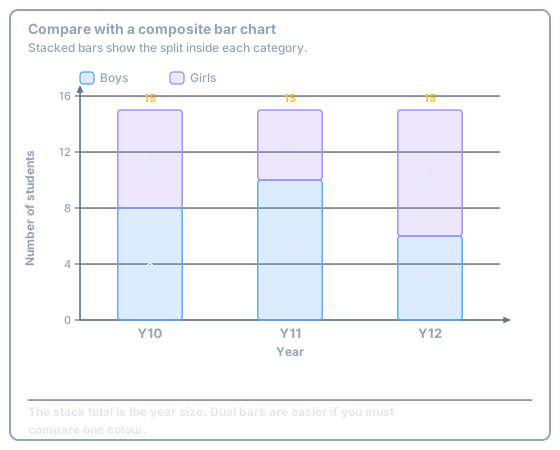
Dual (side-by-side) bars compare the same category across two groups. Composite (stacked) bars show the split inside one group.
Compare with average and spread
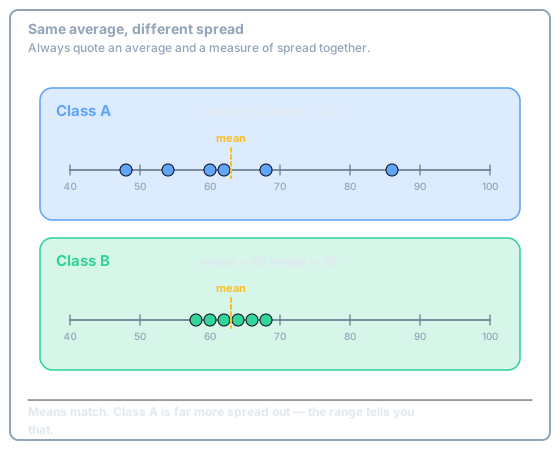
Two classes can share a mean and still look nothing like each other. The range (or IQR, later) is the second sentence of the comparison.
Both classes have mean 63. Which is more consistent?
The denominator is the named group
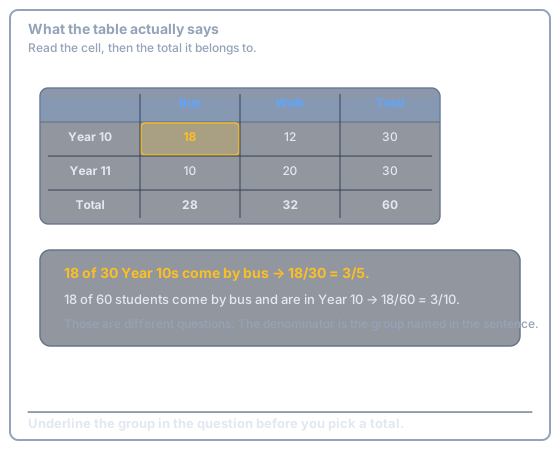
18 Year 10s come by bus. That is 18 out of the 30 Year 10s, not 18 out of all 60 students — unless the question says “of all students”.
Method
- Underline the group: “of the Year 10s”, “of those who walk”, “of all 60”.
- That total is the denominator.
- The cell (or bar height) is the numerator.
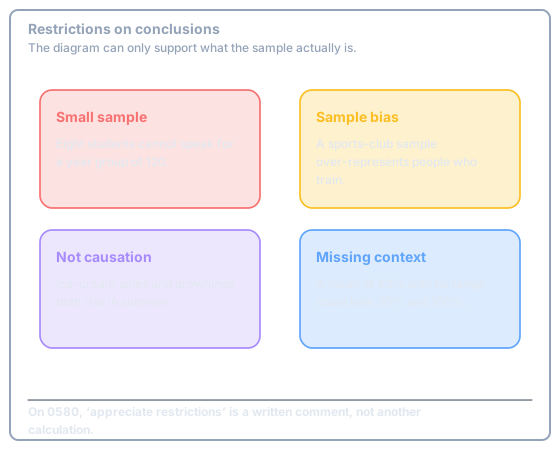
Restrictions on conclusions
E9.2 asks you to appreciate what the data cannot prove. A comment, not another calculation.
Paper 2 (non-calculator)
\(18/30 = 3/5\) by cancelling 6. \(18/60 = 3/10\). The two fractions are not interchangeable.
Try this
From the journey table, what fraction of Year 11 students walk?
Show answer
-
Year 11 row, Walk column 20; Year 11 total 30.
\[ \dfrac{20}{30} = \dfrac{2}{3} \]
Exam Traps
- Dividing by the grand total when the question said “of the Year 10s” (or “of those who take the bus”) is the mark lost on almost every two-way reading.
0/10