Cambridge IGCSE Mathematics — 0580 Extended
Topic 9.5: Statistics — Charts and Diagrams
E9.4 is drawing and reading: dual and composite bar charts, pie charts, pictograms, stem-and-leaf diagrams and simple frequency distributions. Labels, a key, and a sensible scale are marks of their own.
Dual and composite bars
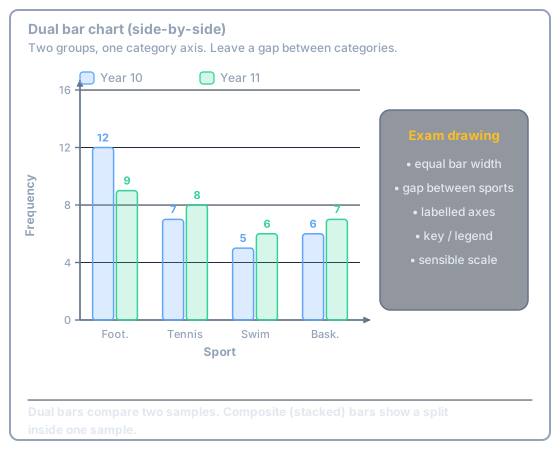
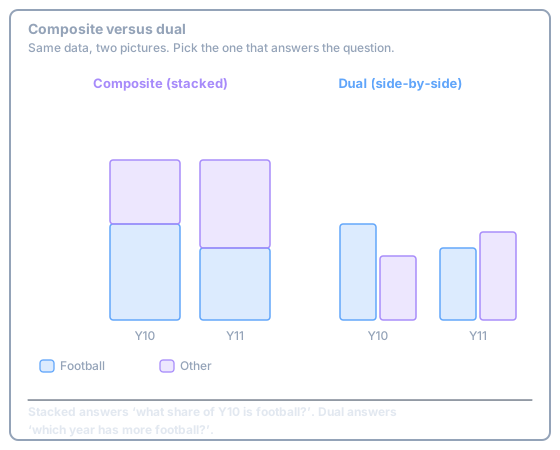
Dual (side-by-side) compares two groups. Composite (stacked) shows the split inside one group. Equal bar width, a gap between categories, labelled axes, and a legend.
Pie charts
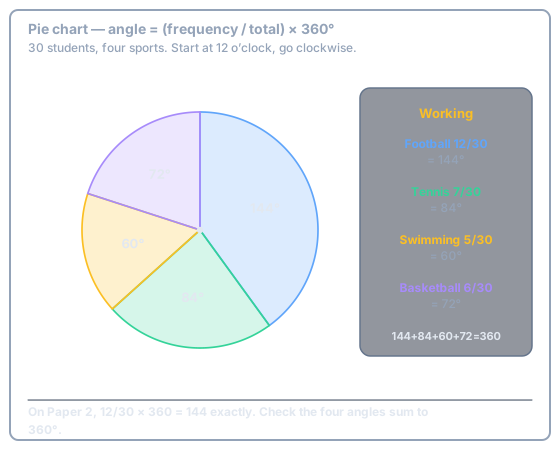
\[ \text{angle} = \dfrac{\text{frequency}}{\text{total}} \times 360^\circ \]
Start at 12 o’clock and go clockwise. The four angles must sum to \(360^\circ\).
30 students: football 12, tennis 7, swimming 5, basketball 6. Find the pie angles.
Pictograms
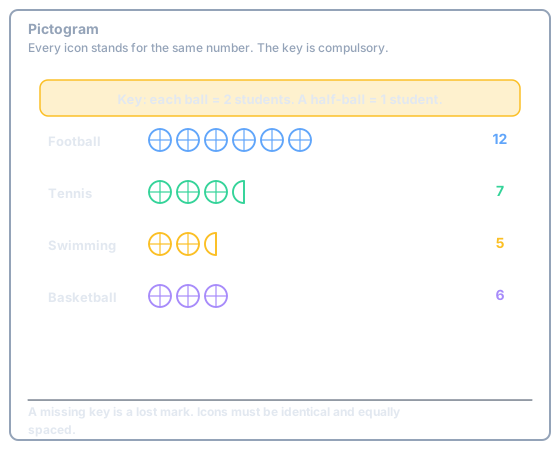
Every icon stands for the same number. A half-icon is allowed if the key says so. A missing key loses the mark.
Stem-and-leaf
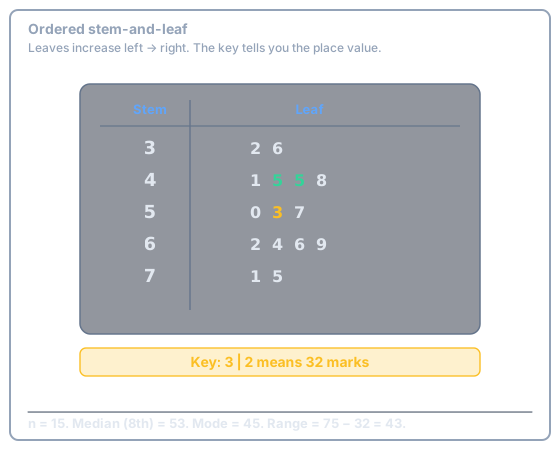
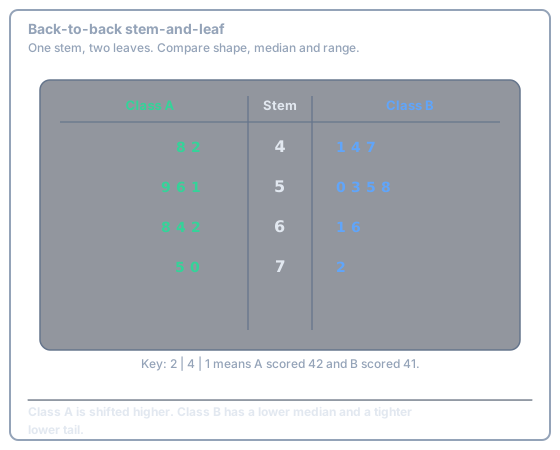
Leaves increase left to right. An unordered stem-and-leaf is incomplete. The key is compulsory and states the place value.
Method
- Split each value into a stem (left digits) and a leaf (last digit).
- Write stems in a column. Order the leaves on each row.
- Write a key, for example \(3\,|\,2\) means 32.
- Median, mode and range can then be read from the diagram.
Paper 2 (non-calculator)
\(12/30 \times 360 = 144\) because \(12/30 = 2/5\) and \(2/5 \times 360 = 144\). Cancel before you multiply.
Try this
From the 15-mark stem-and-leaf, what is the range?
Show answer
-
Largest 75, smallest 32.
\[ 75 - 32 = 43 \]
Exam Traps
- A stem-and-leaf without a key, or with unordered leaves, is not a finished diagram — examiners withhold the drawing mark.
0/10