Cambridge IGCSE Mathematics — 0580 Extended
Topic 9.6: Statistics — Scatter Diagrams
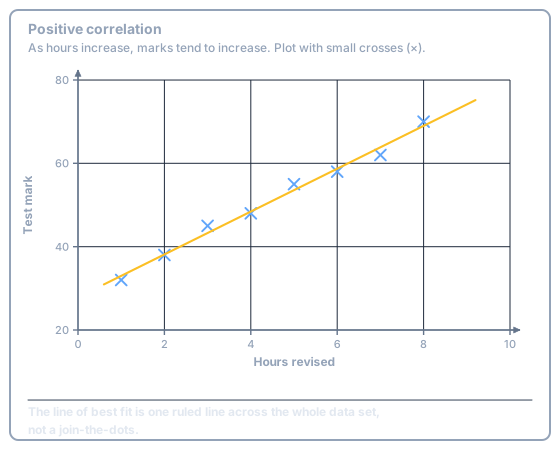
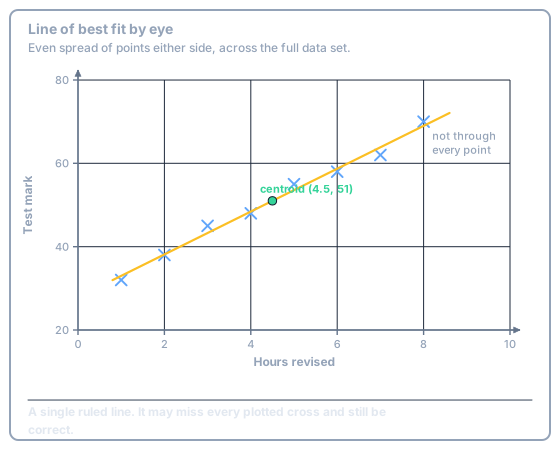
Two quantitative variables, plotted as small crosses (\(\times\)). Correlation is the word for the trend: positive, negative, or zero. A line of best fit is one ruled line, drawn by eye across the full data set, with a roughly even spread of points either side.
Types of correlation
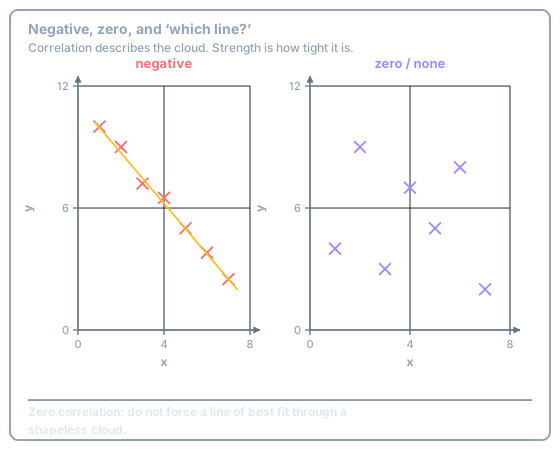
Positive: as \(x\) increases, \(y\) tends to increase. Negative: \(y\) tends to decrease. Zero: no trend — do not force a line through a shapeless cloud.
Line of best fit
One ruled line, across the whole cloud, not a join-the-dots. It does not need to pass through any plotted cross. It should pass close to the centroid (the mean point) and leave points roughly balanced either side over its whole length.
Interpolation
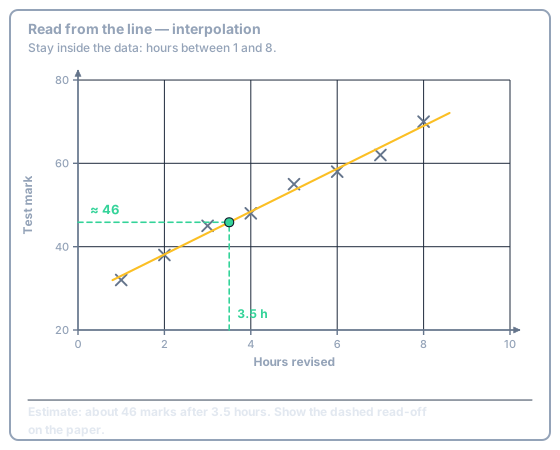
Reading from the line inside the data is interpolation. Draw a dashed line up from the given \(x\), across to the axis, and show it on the paper.
Estimate the mark after 3.5 hours of revision.
Extrapolation
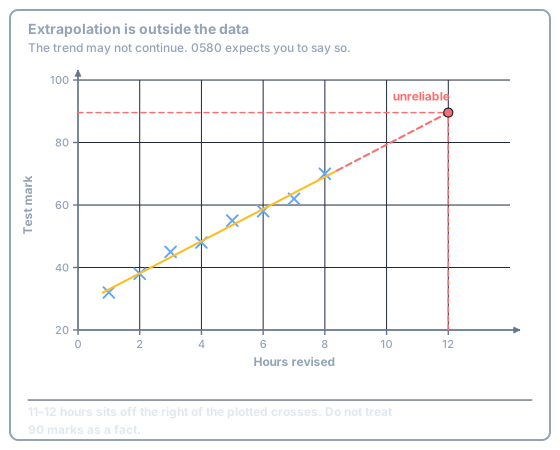
Outside the data the trend may not continue. Extended papers expect the word unreliable (or equivalent) as well as any number you read.
Paper 2 (non-calculator)
Read to the nearest square the graph allows. A mark of “about 46” with construction lines beats a pretend-exact 45.857.
Try this
Why is a mark estimated at 11 hours of revision unreliable?
Show answer
-
11 hours is outside the plotted data (1 to 8 hours). The trend may not continue — this is extrapolation.
Exam Traps
- Joining the first plotted point to the last is not a line of best fit. The line must balance the whole cloud, not the two extremes.
0/10