Cambridge IGCSE Mathematics — 0580 Extended
Topic 9.7: Statistics — Cumulative Frequency
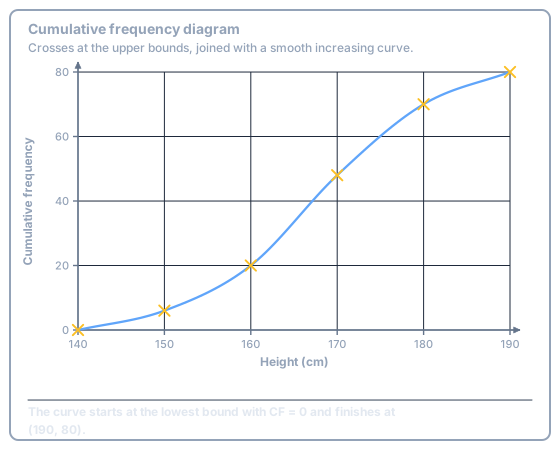
A cumulative frequency is a running total. On 0580 you plot it at the upper class boundary as a small cross, then join with a smooth increasing curve. From the graph you estimate the median, percentiles, quartiles and IQR.
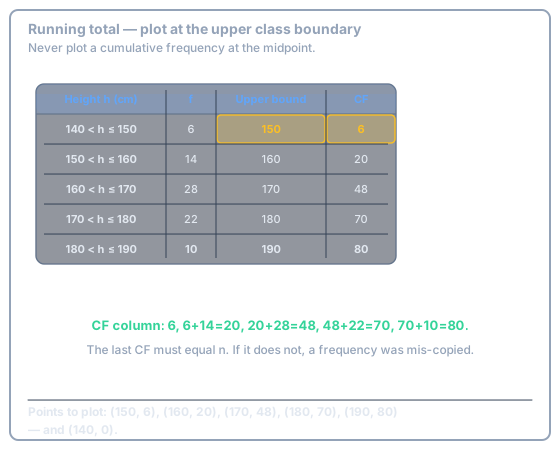
The running-total table
Add frequencies down the table. The last cumulative frequency must equal \(n\). Plot \((\text{upper bound}, \text{CF})\), and include the lowest bound at CF \(= 0\).
Method
- Write the upper bound of each class.
- CF column: add as you go.
- Plot the points as \(\times\). Join with a smooth curve — not a rulered polyline.
The curve
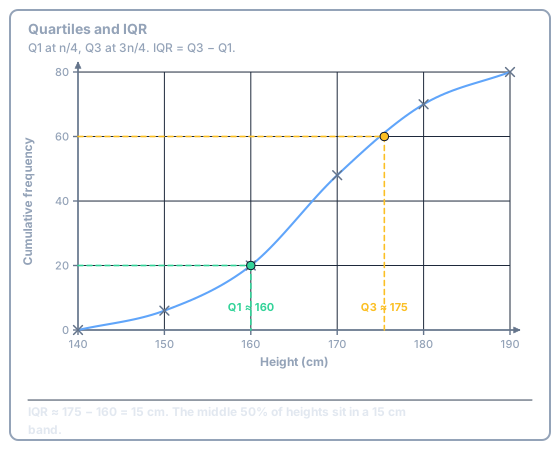
Median, quartiles, IQR
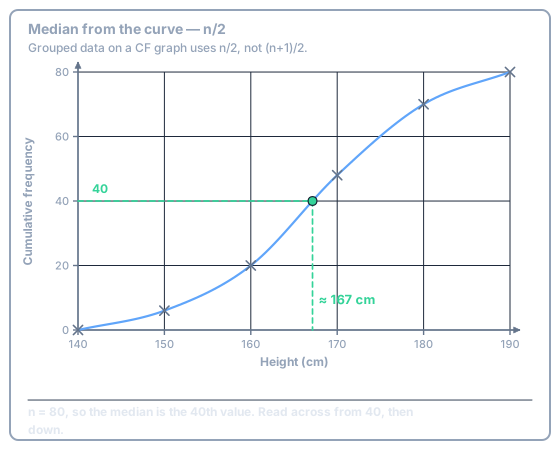
From a CF graph of grouped data, use \(n/2\), \(n/4\) and \(3n/4\) — not \((n+1)/2\). That \((n+1)/2\) rule was for a raw list.
\(n = 80\). Estimate the median height.
Percentiles
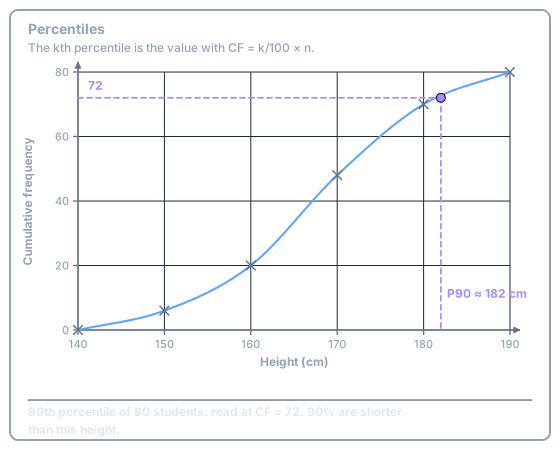
The \(k\)th percentile is the value with \(\mathrm{CF} = (k/100)\times n\). For 80 students the 90th percentile is read at CF \(= 72\).
Paper 2 (non-calculator)
\(n/2 = 40\), \(n/4 = 20\), \(3n/4 = 60\). Those CF readings are exact integers here; the heights you read off the scale are estimates.
Try this
For these 80 heights, at what cumulative frequency do you read \(Q_3\)?
Show answer
-
\(3n/4 = 3\times 80 / 4\).
\[ 60 \]
Exam Traps
- Plotting CF at the class midpoint (or at the lower bound) shifts the whole curve. The median then comes out wrong even if the reading technique is perfect.
0/10