Cambridge IGCSE Mathematics — 0580 Extended
Topic 9.8: Statistics — Histograms
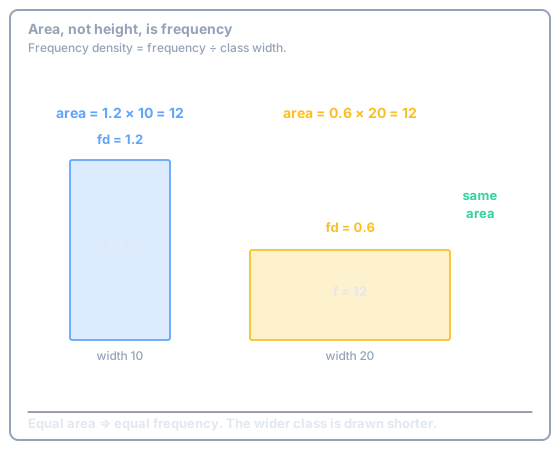
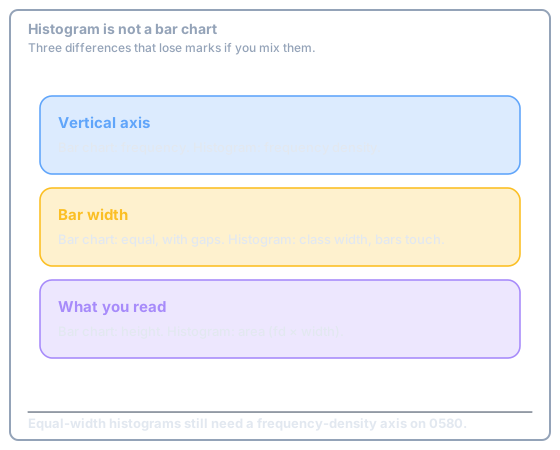
On a histogram the vertical axis is labelled Frequency density, the bars touch, and area equals frequency. Unequal class widths are the Extended skill: a wide class is drawn short so that its area still matches \(f\).
\[ \text{frequency density} = \dfrac{\text{frequency}}{\text{class width}} \]
Area is frequency
Two bars with the same area represent the same frequency, even if one is tall and thin and the other is short and wide.
Frequency density table
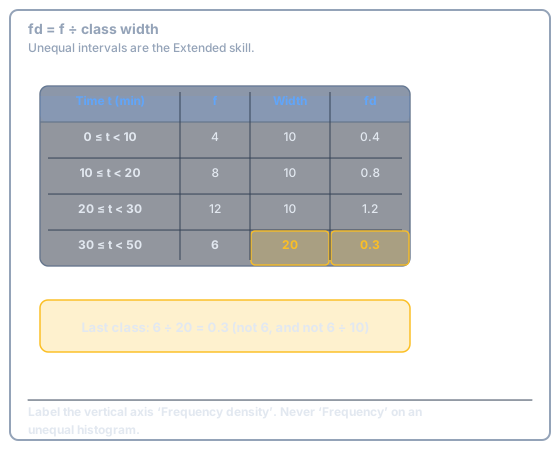
Add a width column, then divide. The last class \(30 \le t < 50\) has width 20, so \(fd = 6 \div 20 = 0.3\), not \(6 \div 10\).
Method
- Class width \(=\) upper end \(-\) lower end.
- \(fd = f \div\) width, for every row.
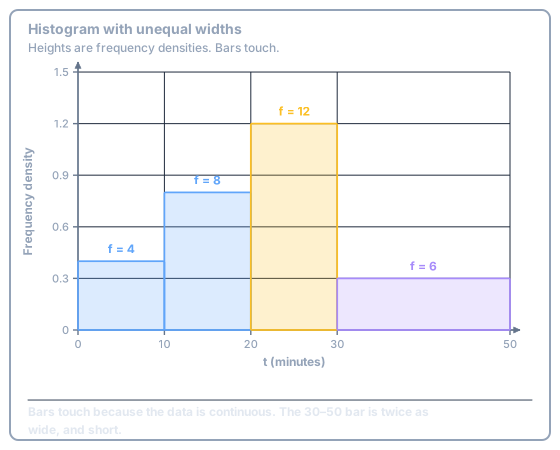
- Draw bars that touch. Height \(= fd\). Width \(=\) class width on the scale.
- Label the vertical axis “Frequency density”.
Drawing the histogram
Draw the histogram of the journey times.
Frequency from a bar
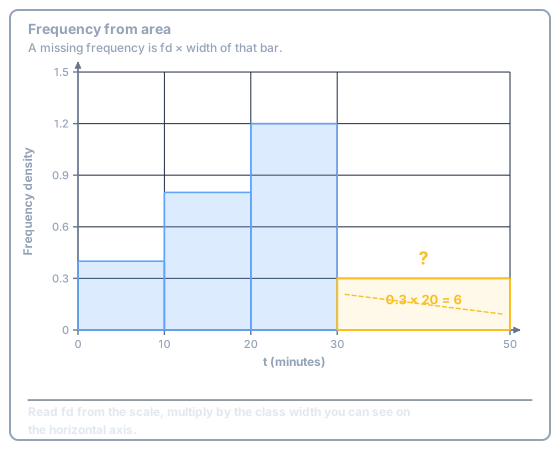
A missing frequency is the area you can see: \(fd \times\) width.
Paper 2 (non-calculator)
\(6 \div 20 = 0.3\). \(12 \div 10 = 1.2\). Keep the decimal; do not “simplify” \(0.3\) to \(1/3\) unless the question asks for a fraction — \(0.3 = 3/10\), not \(1/3\).
Try this
A histogram bar has fd 0.8 and class width 10. What is the frequency?
Show answer
-
Area = frequency.
\[ 0.8 \times 10 = 8 \]
Exam Traps
- Labelling the vertical axis “Frequency” on an unequal-width histogram is a lost mark even if every bar height is numerically right — the heights are densities, not frequencies.
0/10