Cambridge IGCSE Physics · 0625
Chapter 1: Motion, forces and energy — Part 2
Topic 1.2 · Motion
Speed and average speed
Speed is distance travelled per unit time.
v = s / t where v is speed in m/s, s is distance in m, and t is time in s.
Average speed = total distance travelled / total time taken. Use this when speed is not constant for the whole journey.
A cyclist travels 1.2 km in 2.5 minutes. Calculate her average speed in m/s.
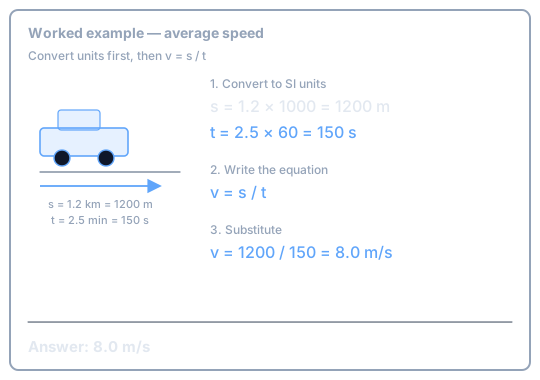
Velocity is speed in a given direction. A car going around a roundabout at constant speed still has a changing velocity because direction changes.
Distance–time and speed–time graphs
You must sketch, plot and interpret both types of graph.
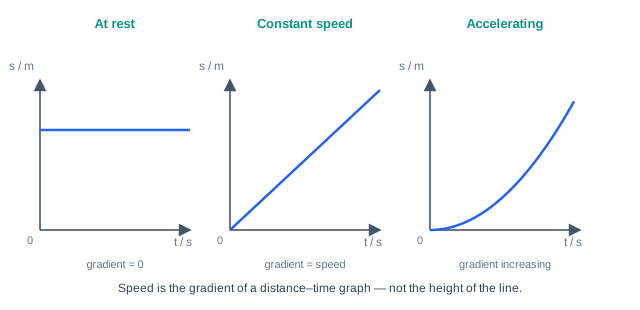
- Distance–time: at rest
- Horizontal line — distance does not change.
- Distance–time: constant speed
- Straight line with constant gradient. Speed = gradient = Δs / Δt.
- Distance–time: accelerating
- Curve with increasing gradient (steeper).
- Distance–time: decelerating
- Curve with decreasing gradient (flattening).
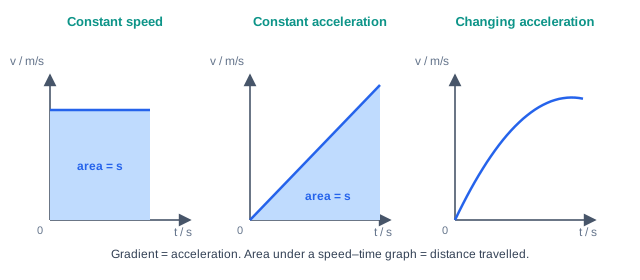
- Speed–time: constant speed
- Horizontal line.
- Speed–time: constant acceleration
- Straight line with constant gradient.
- Speed–time: changing acceleration
- A curve (gradient is not constant).
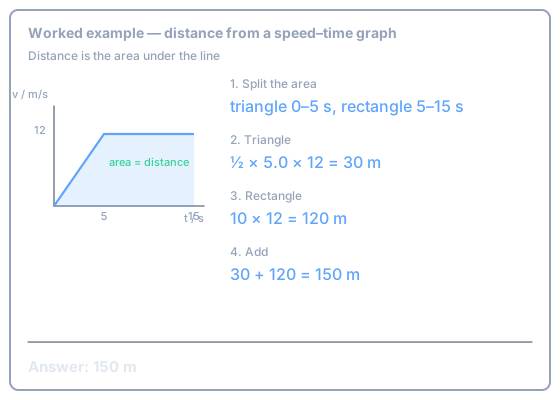
On a speed–time graph, distance travelled is the area under the line for constant speed or constant acceleration (triangles, rectangles and trapezia).
A scooter accelerates uniformly from rest to 12 m/s in 5.0 s, then travels at 12 m/s for a further 10 s. Calculate the distance travelled in the 15 s.
Exam Traps
- Do not read speed from the height of a distance–time graph — speed is the gradient. Area under a distance–time graph is not distance; that rule is for speed–time graphs.
Acceleration of free fall
Near the Earth’s surface the acceleration of free fall g is approximately constant and approximately 9.8 m/s2.
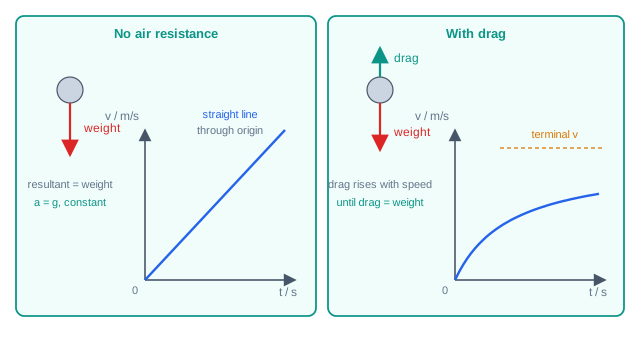
With no air or liquid resistance, a falling object’s speed increases steadily (constant acceleration g).
Acceleration
Acceleration is change in velocity per unit time.
a = Δv / Δt Unit: m/s2.
On a speed–time graph, acceleration is the gradient.
A deceleration is a negative acceleration. Use a negative sign in calculations when velocity is decreasing in the chosen positive direction.
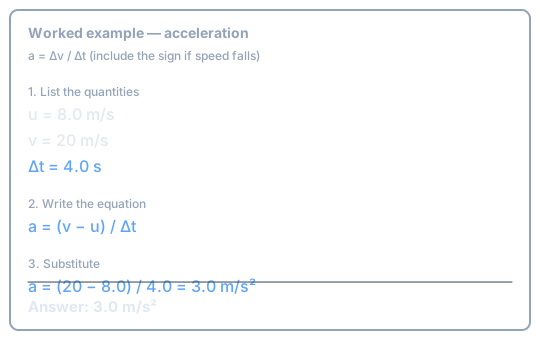
A car speeds up from 8.0 m/s to 20 m/s in 4.0 s. Calculate its acceleration.
Falling with air or liquid resistance
In a uniform gravitational field with air or liquid resistance (drag):
- Weight acts downwards and is constant (for a given mass).
- Drag increases as speed increases and acts upwards.
- Resultant force = weight − drag, so acceleration decreases as the object speeds up.
- When drag = weight, resultant force is zero and the object falls at a constant terminal velocity.
0/10